A simple ELK setup
Time to write something here!
Most of the software we use generates logs: our web server, our application, the OS… We can say everything generates logs . The problem is there’s no convention on how logs should be formatted, so we’re all used to use tail -f to trace errors, or simply grep the logs to find stuff.
While this solution can work for some time, it’s not scalable nor good. These days the ELK stack is becoming really famous:
- Elasticsearch is really popular as a search engine, probably the most popular nowadays, powerful and scalable.
- Logstash is a tool for managing events and logs. It can parse input, filter it and send it somewhere
- Kibana is a web UI for interacting with Elasticsearch. Really easy to use and setup, and results are visually attractive (graphs, charts…)!
I’m not going to explain advanced configurations, just a simple thing. We’re going to install everything and get it up and running on an Ubuntu machine. We’ll assume you have Nginx installed on your system, and you’re interested in parsing the access log.
Install JDK
While we could install OpenJDK or Oracle JDK, let’s do it simpler than that and install the default JDK. Go have a coffee, as this will take some time…
$ sudo apt-get install default-jdkWe need the JDK to run Elasticsearch. That will be our next step!
Install Elasticsearch
$ cd /tmp
$ wget https://download.elasticsearch.org/elasticsearch/elasticsearch/elasticsearch-1.4.2.deb
$ sudo dpkg -i elasticsearch-1.4.2.deb
$ sudo service elasticsearch start
Now we have Elasticsearch running in port 9200. If you do: curl -XGET 'localhost:9200/_search?pretty', you should get a fancy JSON response back from Elasticsearch.
Install Logstash
$ cd /tmp
$ wget https://download.elasticsearch.org/logstash/logstash/packages/debian/logstash_1.4.2-1-2c0f5a1_all.deb
$ sudo dpkg -i logstash_1.4.2-1-2c0f5a1_all.deb
$ sudo service logstash start
Voilá! Now we have Logstash installed. Logstash configuration is under /etc/logstash/conf.d/. Assuming we have Nginx installed and we want to parse logs in /var/log/nginx/access.log, we need to create a parser for Nginx logs.
Logstash comes with some default patterns using Grok. As the website says: Grok is currently the best way in logstash to parse crappy unstructured log data into something structured and queryable. Read a bit about the way Grok works before continuing.
We’ll create the file /opt/logstash/patterns/nginx, where we’ll explain Grok the format we’re trying to parse:
NGUSERNAME [a-zA-Z\.\@\-\+_%]+
NGUSER %{NGUSERNAME}
NGINXACCESS %{IPORHOST:clientip} %{NGUSER:ident} %{NGUSER:auth} \[%{HTTPDATE:timestamp}\] "%{WORD:verb} %{URIPATHPARAM:request} HTTP/%{NUMBER:httpversion}" %{NUMBER:response} (?:%{NUMBER:bytes}|-) (?:"(?:%{URI:referrer}|-)"|%{QS:referrer}) %{QS:agent}
I invested a lot of time reading how to parse log files using Grok… you should do the same! There are loads of Grok configuration files out there for almost all type of log files (in fact, the one above is copied ). But try to understand it, just in case you run into problems at some point!
Now we have our NGINXACCESS filter ready, so let’s create Logstash configuration for our access log file. Create /etc/logstash/conf.d/nginx.conf:
input {
  file {
    path => ["/var/log/nginx/access.log"]
  }
}

filter {
  grok {
    match => { "message" => "%{NGINXACCESS}" }
  }
}

output {
  elasticsearch {
  	host => "localhost"
  	protocol => "http"
  }
}
Easy configuration file:
- We read from (input) a file, which is the Nginx access log file
- We apply a filter (the one we created before) over each new line we read
- Resultant JSON is sent to the Elasticsearch instance running locally
Let’s reload Logstash to read the new configuration file:
$ sudo service logstash force-reloadRight, we’re done! If you’re not understanding something, probably you’ve still not read any documentation :-1:. Go and read some, please!
Workaround: Logstash creates a user (logstash), and it will probably not have permissions to read the /var/log/... directory. You can read more here. While there are multiple solutions to the problem, the best is to do this:
$ sudo setfacl -m u:logstash:r /var/log/nginx/access.log
$ sudo usermod -a -G adm logstash
This will allow logstash to read the access file, and also add the logstash user to the adm group (probably the one owned by that file).
Now you should be able to write something to the log file (by accessing the browser) and after some seconds (defaults 15 seconds) Logstash will inspect the file, parse it using Grok and send that info to Elasticsearch! If you query again Elasticsearch, you should see something like this:
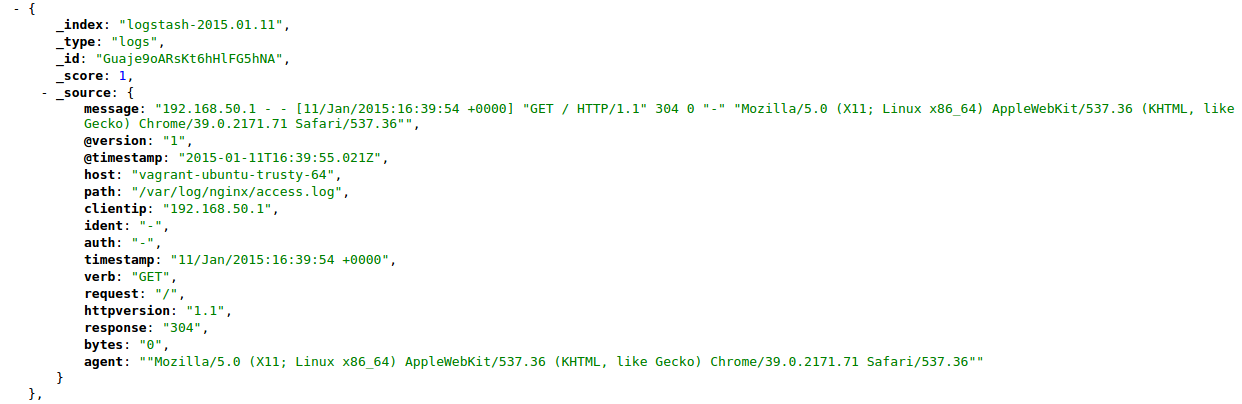
Yay! Our Nginx access log is being indexed! Just one more step, we need Kibana up.
Install Kibana
$ cd /my/web/directory
$ wget https://download.elasticsearch.org/kibana/kibana/kibana-4.0.0-beta3.zip
$ unzip kibana-4.0.0-beta3.zip
$ ./bin/kibana
If you prefer, you can instead download a .tar.gz. It’s up to you! Starting Kibana takes some time, so be patient! As we’re installing Kibana 4 (still a beta version, but quite stable), we need Elasticsearch >= 1.4.0.
This is my production setup
Hope not! This is just an ultra-quick introduction to the ELK stack. But far from the best setup, I’m afraid.
When using in production, please ensure Kibana is running behind a proper web server (Nginx, please ). And probably add some sort of authentication; you don’t want your cool charts to be public .
Also, this is not showing all the possiblities the ELK stack brings, so please read the documentation for all three projects and take advantage taking into account your use-case.
We’ve installed the ELK stack as the server collecting logs, and the server shipping those logs, but if you have a cluster of servers, you should not install Elasticsearch / Kibana in all of them… Instead, just install Logstash and send that information to a shared Elasticsearch instance.